Terminology Guide - "R"
Range: The price difference between the high and the low for a specific period.
Rectangle: A continuation chart pattern in which the price moves in a sideways manner before breaking either the upper or lower end of the rectangle, which signals a trend continuation. Also referred to as a trend channel.
Relative Strength Index (RSI): A commonly used oscillator that provides potential trend reversal signals. Any RSI value over 70 indicates that the stock is overbought and any RSI value under 30 indicates that the stock is oversold.
Resistance: A price level in which a stock has difficulty breaking above. Many investors like to exit long positions or enter short positions at resistance.
Retracement: A decrease in price that amounts to a certain percentage of the previous move up. Retracements usually amount to ⅓, ½, or ⅔ of the prior move. Traders also use the fibonacci retracement percentages to measure price retracements.
Reversal Pattern: A chart pattern that signals a reversal of the current trend.
Reverse Stock Split: A stock split that reduces the total number of outstanding shares and increases the price per share. A stock split of any kind does not add value to a stock.
Rip: A quick increase in share price with momentum.
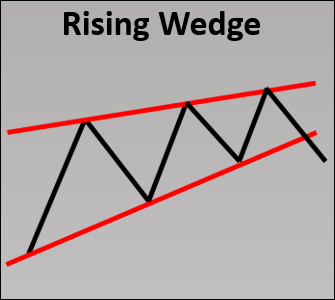
Rising Wedge: A bearish reversal pattern in which two upward trend lines are converging. When the price breaks down below the lower upward trend line, the stock signals a reversal.
[btnsx id="2797"]